|
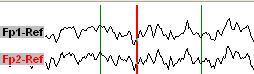
Cursor is represented by vertical red line. Place cursor by left clicking mouse over desired EEG
datapoint. Time and amplitude of datapoint are displayed in statusbar.
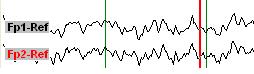
Position 1
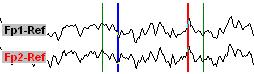
Position 2
Drag cursor to select interval between datapoints for
measurements. Some
measurements (time diffference, frequency, peak-to-peak amplitude) and analysis
functions requre to
set two cursors. When dragging cursor, blue vertical line (cursor 2) remains
at old cursor position, whereas cursor 1 (red color) represents new
position.
|